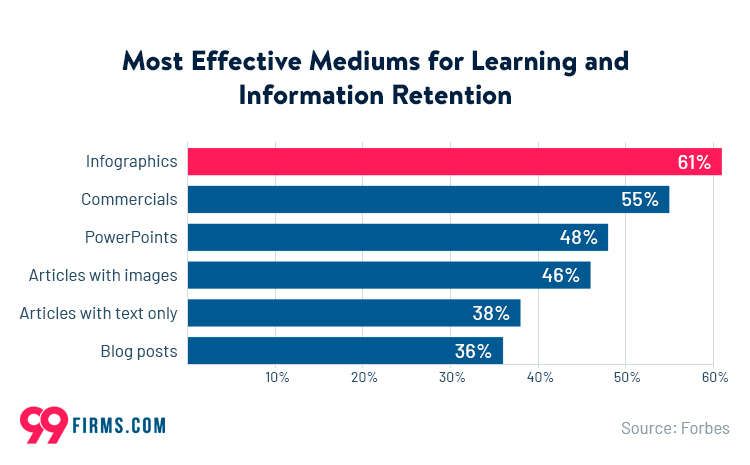
Humans tend to remember 65% of what they see, as opposed to just 10% of what they hear.
This fact underscores the importance of delivering information in a way that’s easy to understand, using a mix of images and text.
Now, let’s delve into the world of infographics for SEO and what you need to grasp to create an impressive one.
Ready to craft a stellar infographic?
What are Infographics?
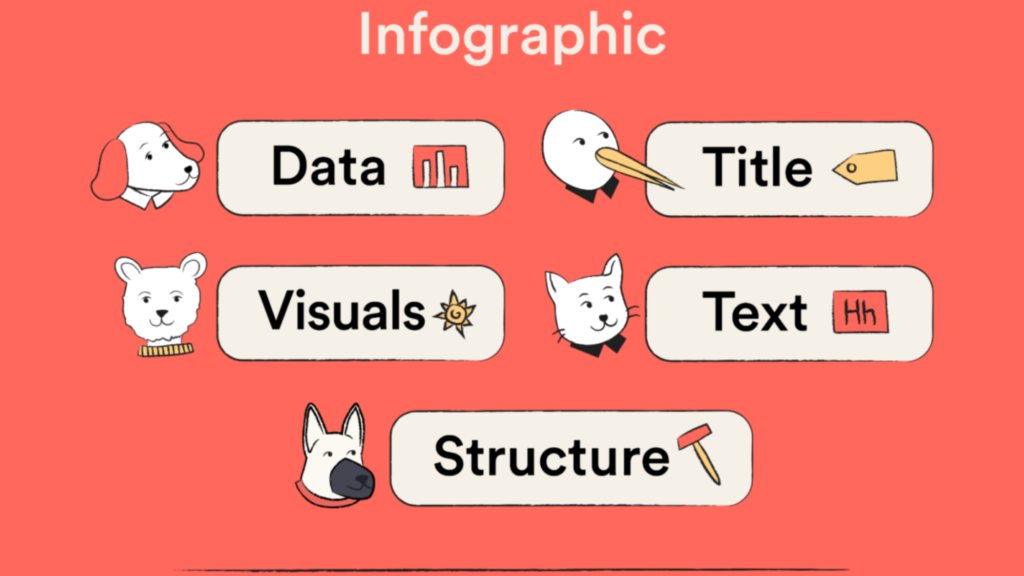
An infographic is like a picture that explains information. It’s a helpful way to show people details by using pictures, charts, and numbers.
Infographics help share information quickly. They can cover different things, like:
- Images
- Icons
- Text
- Charts
- Graphs,
- Diagrams
While visual content can be helpful, it’s crucial to think about how long your audience pays attention.
Research has proven that incorporating colors in images boosts readers’ focus and memory retention by 82%.
When used correctly, infographics can improve your search engine ranking, enhance brand recognition, and get more backlinks.
They also simplify complicated concepts, making them easier to grasp and more visually appealing.
Importance of Infographics in search engine optimization
Colors, empty spaces, and various elements can make information stick in your mind, grab your attention, and even make it interesting.
Use infographics to:
- Boost Your Social Media Shares!
- Get More Visitors to Your Website.
- Build Your Brand Recognition.
- Support Your Link Building Efforts.
- Appear in Google Image Searches.
- Establish Yourself as an Industry Expert or Opinion Leader.
Infographics are a great way to share information in a visual format and are super effective for digital marketing.
Take David McCandless as an example. He’s the person behind Information is Beautiful, and he’s really good at using visuals to explain what makes an infographic or data visualization effective.
In his proposal, he included four key things to keep in mind when creating infographics or visualizing data:
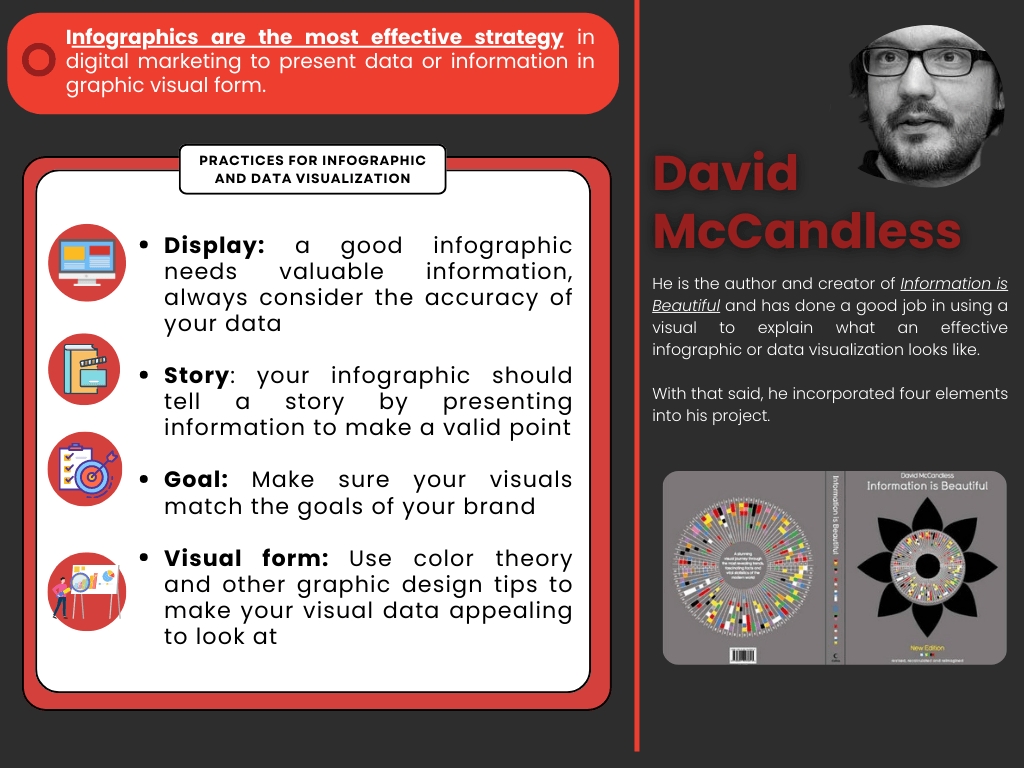
- Make sure the information in your infographic is correct and helpful.
- Share a story through your infographic by giving important details to make a strong point.
- Objective: Why do you want to create an infographic, aside from sharing information? Ensure your pictures match your brand’s goals.
- Visual style: Is your infographic easy to understand? Improve the visual appeal of your data by using colors and other graphic design methods.
When it comes to SEO, infographics provide unique benefits, especially online, where some businesses find it hard to get noticed.
The specific advantages are:
- Increased traffic
- Better link building
- Relevancy
- Versatility
A picture made for a particular group of folks is a great way to boost your website visits without paying for ads. If it’s interesting and fits the topic, it can be super helpful.
According to Search Engine Journal, creating content and building links are two big things for getting a good rank.
Building links can be hard, but using infographics can make it easier.
People always want new things to share or retweet, so making a really good picture can catch the eye of a specific group.
Others might want to pass along the info you gave and connect it back to you. Sharing a cool infographic online can last for a long time.
Your influence in the field decides how you can tackle various subjects in a special way. This way, you increase the likelihood of your content staying popular for years, even after it’s been posted.
Making content easy to understand and engaging is crucial for your audience. Infographics are great because they’re visual and improve user experience.
By having a flexible content marketing strategy, you can turn one infographic into various content pieces.
Here are some other benefits of using infographics in your content:
- Socially shareable
- Reduces bounce rate
- Increases SERPs rank
- Easy to understand
- Better outreach opportunities
- Boosts brand awareness
- Shows your expertise
- Strengthens your SEO
How infographics can impact your SEO
Before we move into the practical side, let’s discuss why infographics are essential for your content marketing strategy.
Infographics have a proven track record of boosting web traffic by at least 12%, making them a staple in the toolkit of SEO experts.
Primarily, infographics facilitate the acquisition of organic backlinks. Users are eager to distribute eye-catching infographics brimming with valuable data and insights across their websites.
By incorporating an embed code on your website, you enable seamless sharing of your infographic on others’ blog posts or landing pages, ensuring proper credit and a link back to your original source.
Types of Infographics
Infographics are super valuable for tackling all sorts of topics. They come in different types, each serving its own special purpose.
- About products: Showcase main features of a product or service. Use big visuals, keep it simple, and make it easy to grasp.
- Scientific: Simplify complex ideas, use numbers for data, and add icons. Always cite sources for credibility.
- Geographical: Use vibrant colors and maps to illustrate locations. Utilize arrows and icons for clarity.
- Biographical: Cover a person’s life, including background, education, and achievements. Use timelines and photos for context.
- Processes: Visual schemes featuring clear illustrations and photos, frequently used to convey information effectively.
- Statistics: Perfect for presenting figures like monthly balances and conducting research involving statistics, percentages, and other data.
- Journalistic: Based on real-life stories or ongoing court cases, presented in chronological order with detailed sources.
- Comparative: Commonly used for comparing products, people, locations, and businesses, providing insights into benefits, differences, and similarities with accurate data.
- Hierarchical: Ideal for demonstrating step-by-step processes or organizational structures, such as techniques that require proper completion or organizational charts.
How Do I Create an Infographic for SEO?
Easy Steps for Making an Infographic:
- Step 1: Begin with your goal in mind.
- Step 2: Pick a topic that matters to your audience.
- Step 3: Choose the right words and titles.
- Step 4: Make your infographic based on the chosen words and topic.
- Step 5: Improve search engines (use alt text, metadata, etc.).
- Step 6: Gather your data and think about the colors.
- Step 7: Create a copy of your outline.
- Step 8: Choose a good layout template.
- Step 9: Follow the best practices for infographic design.
Creating impactful infographics is easy when you follow these steps:
- Stick to a few easy-to-read fonts.
- Choose colors wisely (use contrasting colors, limit bold colors, and understand color theory).
- Ensure your infographics work well on both mobile and desktop devices.
Pick a topic that suits your audience’s needs best.
Hubspot is a well-known SEO expert. They share numbers using charts, graphics, and visuals to boost backlinks, traffic, and other important stats.
Keyword research is crucial for SEO and works well when creating infographics.
Use target keywords in infographics, just like you do in other content, such as blog articles.
It’s a good idea to improve your infographic just like you would with a blog post or any other image. This helps Google’s crawlers understand your image better.
Here are some tips for making your infographics better:
- Find the main word you want to focus on.
- Get your visual information ready for better online search results.
- Keep your written content at a good length.
- Keep an eye on how fast your website loads.
- Upgrade your social media sharing buttons.
- Make sure your Call-to-Action buttons are easy to see.
Moreover, create a backup of your information and decide what you want in your visual representation. Pick a suitable design and begin working on it!
What should I include in an infographic for SEO?
Remember to include where you got your information, like data and sources, in your writing.
Infographics are like pictures, and Google’s robots can’t understand them like regular text.
But no worries, there are many ways to make sure the web pages displaying your infographic are set up well for search engines and the people you want to reach.
Now, let’s consider a few elements to include in your infographic:
Optimize your filename and use commonly supported file types
When you’re getting your pictures ready for Google, it’s a good idea to give them names that describe what they show.
You can also make infographics better for search engines (SEO) using the same approach.
A filename is just the name you give to your picture file before putting it on your computer.
Here’s a quick tip: make your image file smaller, use file types that are widely supported, and add a file that shows all your images (an image sitemap).
By naming your pictures with SEO in mind, you can boost your rankings on search engines and get more people finding your stuff. It’s an easy trick that only takes a few seconds.
Let’s talk about a few things you should keep in mind to make your file names work better:
- Pick file names that make sense and tell you what’s inside.
- Add descriptive words to the images to help with keywords.
- Shrink your image sizes.
Here are some easy steps to make your files smaller:
- Resize your photos to fit your webpage width.
- Use a smaller image.
- Decrease the color depth.
When saving an image, start with JPEG, and then use PNG if needed. Match your filename’s extension with its category.
Don’t forget to include alt text and information. Alt tags and meta tags for images are important. They help Google understand your page.
Beyond helping search engines, they also make your content more engaging for your audience. They help get your point across effectively.
Here are some tips for adding alt-text and metadata:
- Explain what you see in the picture.
- Share details related to your problem.
- Limit your alt text to 125 characters.
- Avoid beginning alt text with “picture of.”
- Incorporate your important words.
Additionally, monitor how fast your page loads and its overall performance.
As per Google’s study, if your web page takes longer to load, going from one second to three seconds, there’s a higher chance (32% more, to be precise) that visitors might leave without exploring further.
Optimize your header tags
Header tags play a crucial role for your readers and search engines. They give a sneak peek into what your content is all about and help Google understand your page better.
They also set up a clear order of importance.
When you use header tags, it tells people what to expect from your content. Don’t forget to include your main keywords in the H1, H2, and H3 headers for better visibility.
Here are some tips for making effective header tags:
- Each web page should have only one main heading (H1 tag).
- Arrange your titles in a logical order.
- Include your main keyword in the title for clarity.
- Clearly indicate the topic of your section.
In addition, it’s crucial to enhance your HTML and URL for better results, as Google considers keywords in URLs for ranking. Using concise and descriptive URLs can boost link building and keep users engaged.
Best practices for HTML and URL optimization are:
- Look into your website’s data.
- Dive into keyword research thoroughly.
- Optimize for both on-page and off-page SEO.
- Ensure your website is mobile-friendly.
Write out your meta description
A meta description is like a little summary that tells people what your website is all about when they click on your link.
Make sure it says what viewers can get from your content.
To help search engines organize your stuff, use a specific term in your meta descriptions.
A study found that Google often doesn’t pay much attention to meta descriptions, especially for pages on the first search results page.
Now, let’s talk about some simple tips for writing your meta descriptions:
- Consider who you’re talking to.
- Be creative and helpful.
- Keep it the right size (155-160 characters).
- Add a call-to-action.
- Incorporate the words you’ve picked.
- Avoid using automatic description tools.
Best tools for SEO infographic creation
Here are some tools to help get you started:
Visme
Visme is a tool for designing infographics. With it, you can create different visuals for your websites, like infographics, web banners, polished resumes, and even interactive presentations.
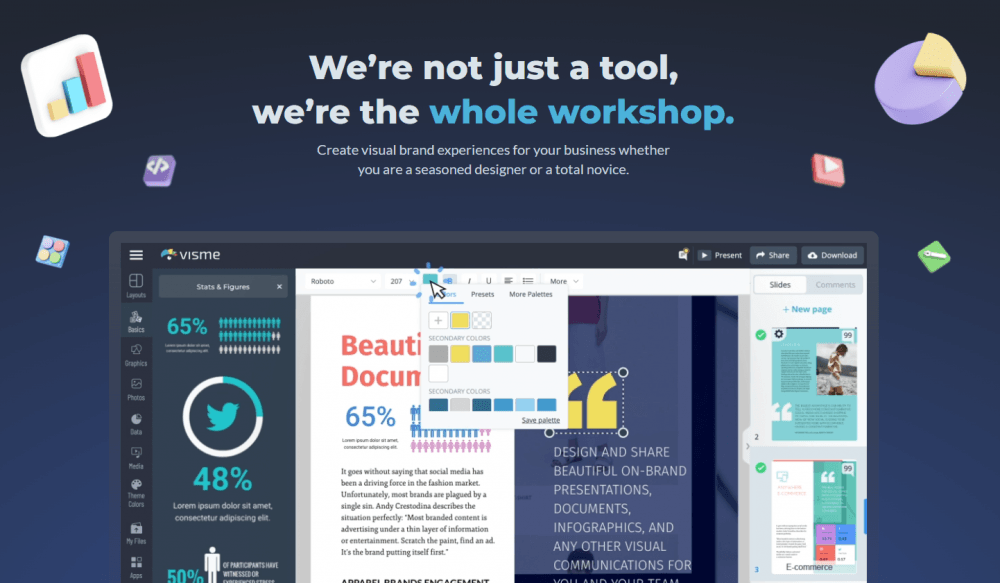
They have a lot of icons and pictures to choose from. Visme is easy to use and flexible for beginners.
It’s a great tool for people who may not have advanced graphic design skills.
You can either pick a template or begin with a blank canvas. The basic version is free, and there’s also a premium version available.
Venngage
The Venngage tool for making infographics offers lots of templates for charts, maps, and symbols. It helps website owners create infographic designs in three easy steps.
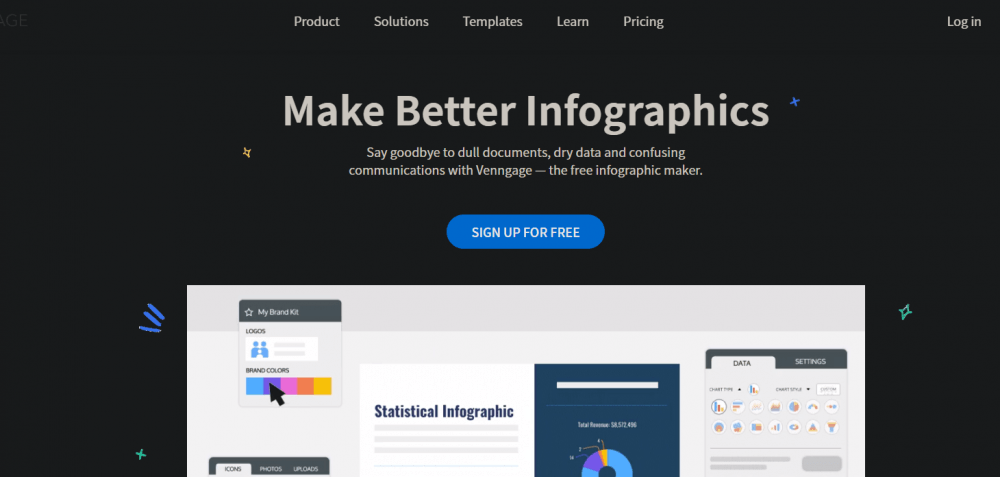
Using this tool, you can:
- Easily move images from the library by dragging and dropping them.
- Make your own icons.
- Change the font to fit your style.
You can save your infographics as photos, PDFs, or quickly share them on social media, websites, and blogs.
Canva
Canva is a great tool for making eye-catching designs. It helps you create things like infographics, presentations, resumes, business cards, logos, and even animated films.
You can use Canva for both personal and business projects, giving you lots of options for design. This program has all the tools you need to make impressive graphics.
Infographics and Your SEO strategy
Graphics and pictures can really help improve your SEO.
Pictures are more likely to be shared a lot, like when something gets really popular and everyone sees it.
So, pictures can be seen by a lot of people, even more than a blog post.
Research has found that content with pictures or visuals gets 94% more views compared to content without them.
Now, let’s talk about some good ways to use pictures in your content plan.
Here are some helpful tips for incorporating infographics into your content plan:
- Make a plan for using infographics.
- Figure out what you want to achieve.
- Choose where to share on social media.
- Make your infographics and articles using important words and hashtags.
- Check the outcomes and make changes as needed.
Link building can attract more people to your site by putting links in your infographics.
Ways to Share Your Picture-Guides:
- Plan how you’ll share your picture-guides on social media.
- Talk to famous blogs and influencers about your visual information.
- Make sure your picture-guides work well with search engines (this is super important).
- Use your picture-guides in different ways.
Spread the word about your picture-guides online and offline (tell people, print them out, etc.).
Let’s Wrap it Up
Visuals like infographics can boost your website’s popularity, make your brand more known, and enhance the user experience.
Infographics grab your audience’s interest and hold them on your site for much longer compared to regular text content.
When you opt for our fantastic GREAT Guest Posts managed SEO package, you can include infographics too.
If you’re not sure how to start, chat with one of our experts today!
Also, feel free to sign up for free and make the most of all our SEO tools without any cost.
Author: Jugnu Nagar
SEO Specialist